Issues / #713
#713 Proposal: a common benchmark format and a comparison page for community reports
open · @brenoperucchi · 4 评论 · 在 GitHub 查看
BenchmarksMulti-GPUModels & quantsDocumentation
描述
This is a question before any work: would something like the following be useful to you, and if so, where should it live? ## The problem Benchmark reports keep coming in, but they can't be compared with each other. On 2026-10-03 there were 14 open `bench:` PRs. `docs/COMMUNITY_BENCHMARKS.md` asks people to use their own data format, so prompts, cache state, sampling, run counts and reasoning settings all differ from one report to the next. You also said in #443 that measurement records stay out of the repo, and a row in `docs/COMMUNITY_BENCHMARKS.md` is the accepted path (#602, #617). Nothing below asks to change that. Still, nobody can answer two questions from the reports that exist today: - For you: did release B get faster or slower than A, on which GPUs, CPUs, models and modes, and which options actually help? - For a user: someone with a machine like mine got better numbers. What exactly did they run, and how is it different from my config? Two of my own reports came out of running the same prompts and procedure across versions on my machine. The unbuffered file tier regression in 0.1.38 (#577) only shows up on GGUF-in-place models, and `STRATA_PF_FUSED=1` changing answers (#519) only showed up with a deterministic A/B. ## The idea There are three pieces, and none of them touches the engine: 1. A `result.json` format, written by a script, never by hand. It records the machine (GPU, VRAM, CPU ISA, RAM, driver, OS), the engine version and binary hash, the model files and their hashes, the run config exactly as used (`args` and `env`, with paths replaced), the protocol (prompt hashes, sampling, output cap, runs, server starts, cache mode, reasoning settings sent) and every individual run. 2. A runner script that starts `server.py` from the user's own unchanged config, measures through the normal API, reads the startup log, then stops and restarts the server for the next arm (A, B, A, B). It follows the bar you set in #500: alternating pairs, and a short parity arm at a fixed `--expert-cache` with `--prompt-cache 0 --adapt-swaps 0 --pcie-frac 0` and `STRATA_IQ_MT_MIN=1` to compare output tokens. 3. A static page that reads those files. It has two views with a shared nav bar. Reasoning isn't fixed by the protocol. People run with it on or off, so the runner records the effort and budget sent and the reasoning tokens generated. Rows with different reasoning settings never share a statistic, and the page can filter on it. ## The community view (for you) This is a throwaway prototype with made-up numbers. Only the hollow points are real (from my #433 data), and they're marked as legacy because that runner used a timestamp line, so the input wasn't byte-identical across versions. 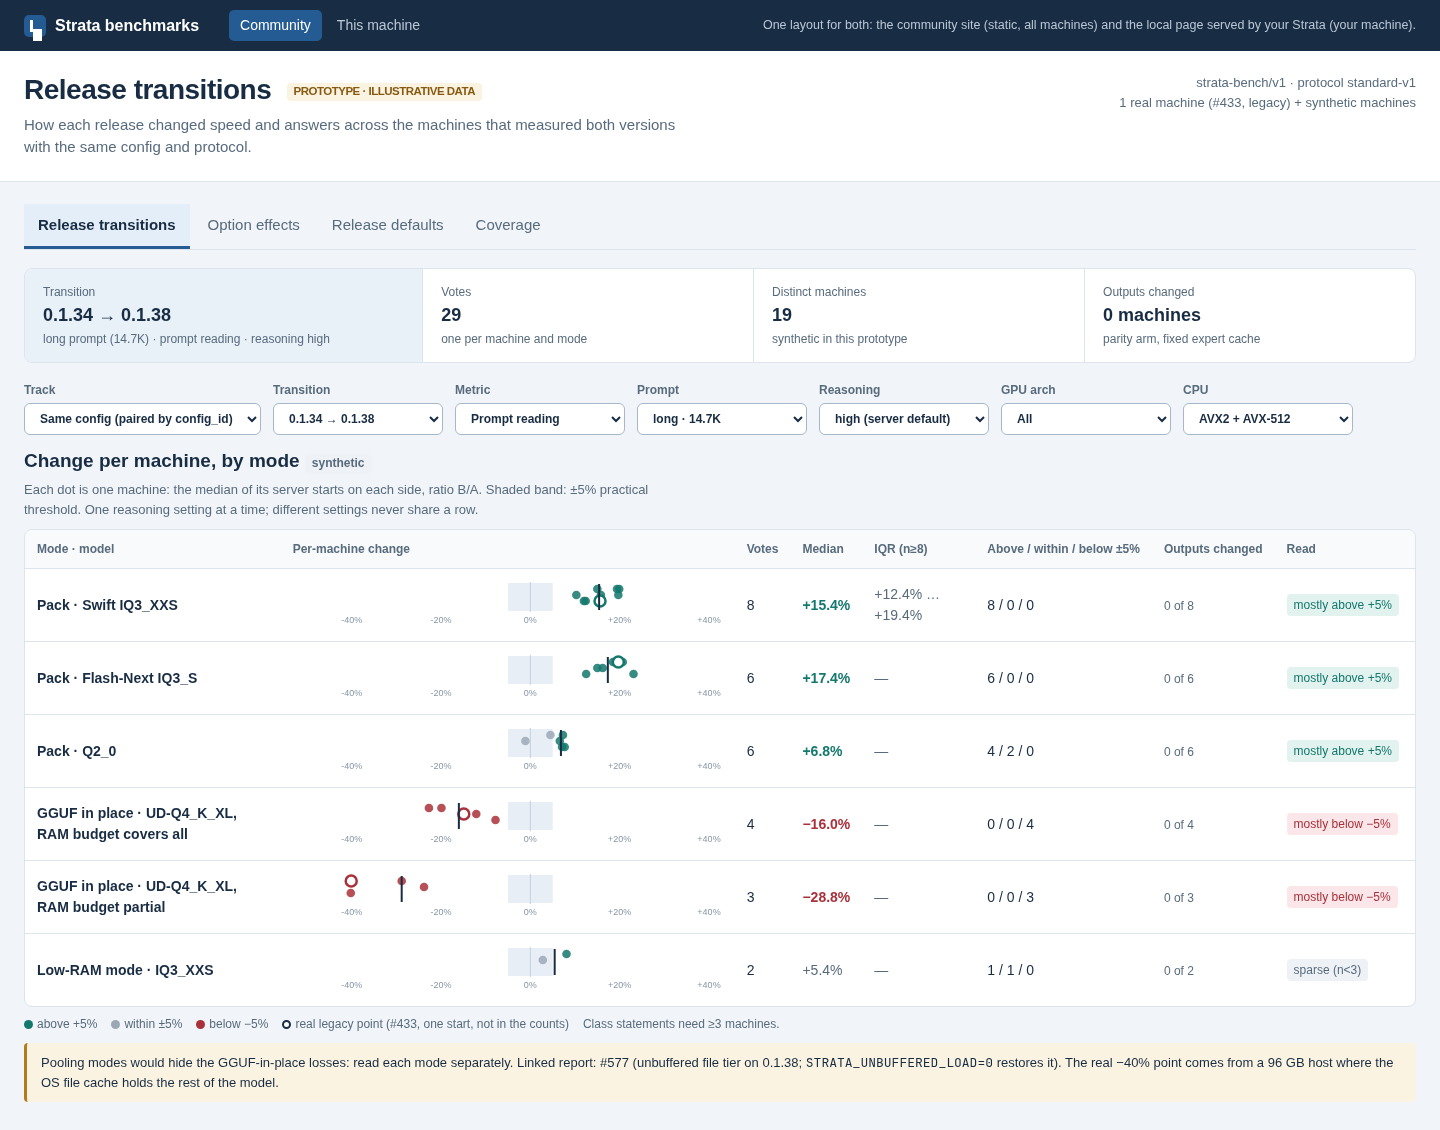 Each machine counts once. For a release pair, a machine contributes the ratio of its own medians (B/A) for the same model, config and protocol. The page shows the median change across machines, the spread, how many machines there are, and how many improved or regressed past a fixed floor. Below 3 machines it says "insufficient data" instead of a percentage. Nothing is averaged across prompt sizes, models or protocols, and machines aren't ranked against each other. The same transition can be split by GPU architecture, CPU ISA, RAM, model, quantization and mode (pack, GGUF in place, RAM budget, low RAM). That split is what would have made #577 visible right away: flat on packs, a clear drop on GGUF in place. 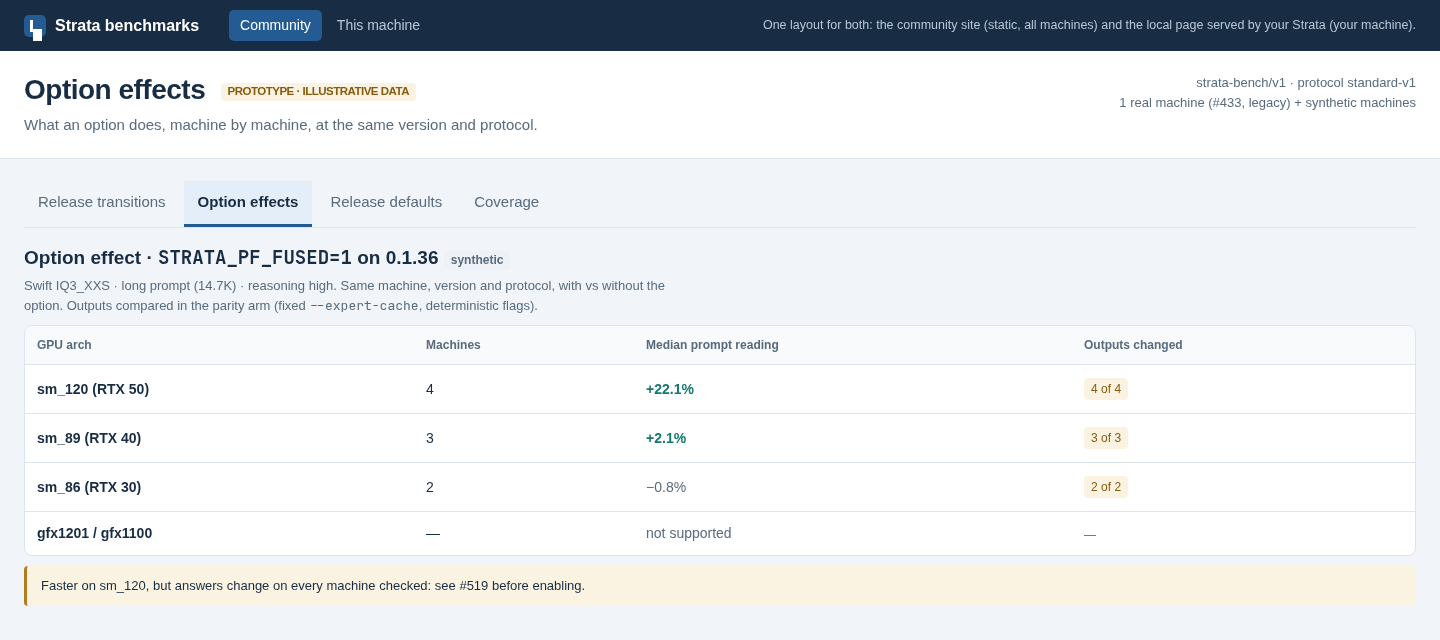 Option effects compare the same machine and release with and without one flag or env var, for example `STRATA_PF_FUSED=1` by GPU architecture. A coverage tab shows which release and hardware combinations have no data yet, so a gap doesn't read as "no change". 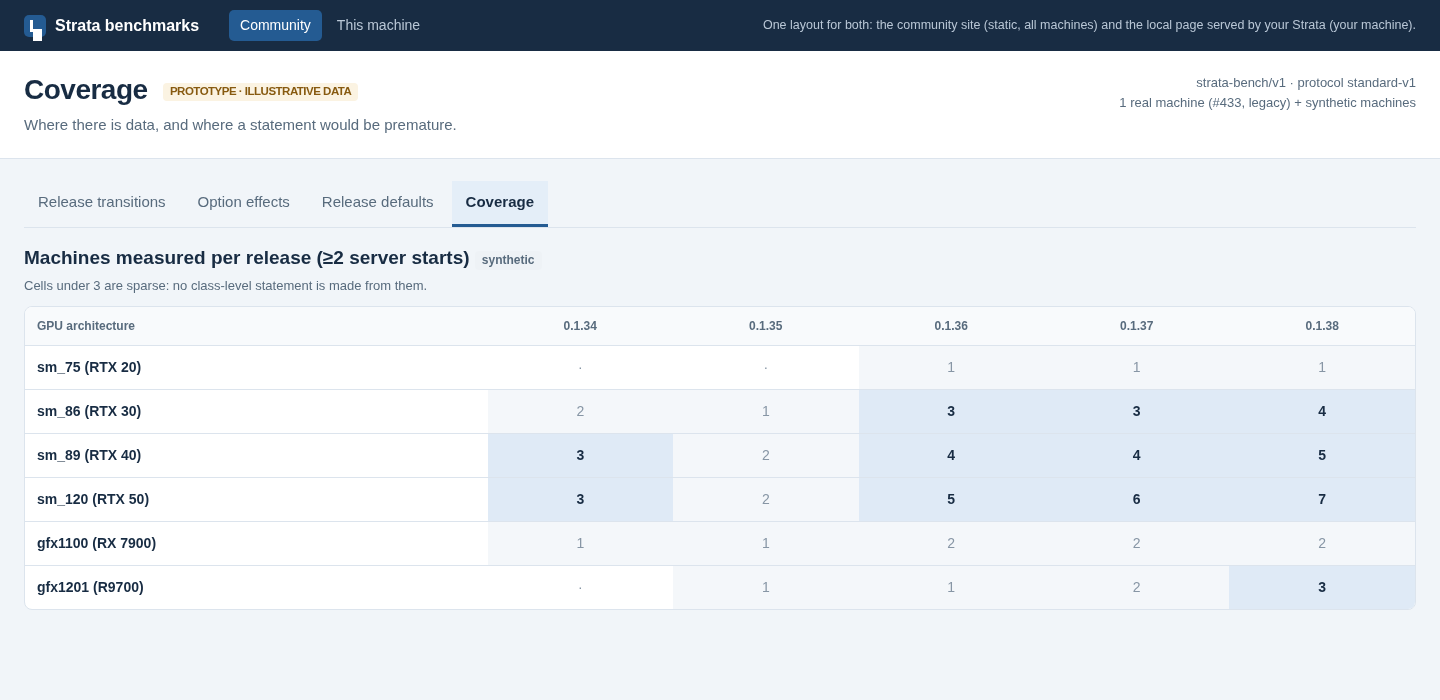 ## The user view This side is about one machine and reproducing what helped. I already use a version of it on my machine: a local panel with every release and variant I measured, side by side per prompt size, with source and hashes on each row. The screenshot is that panel as it runs today. It only holds Strata speed numbers. 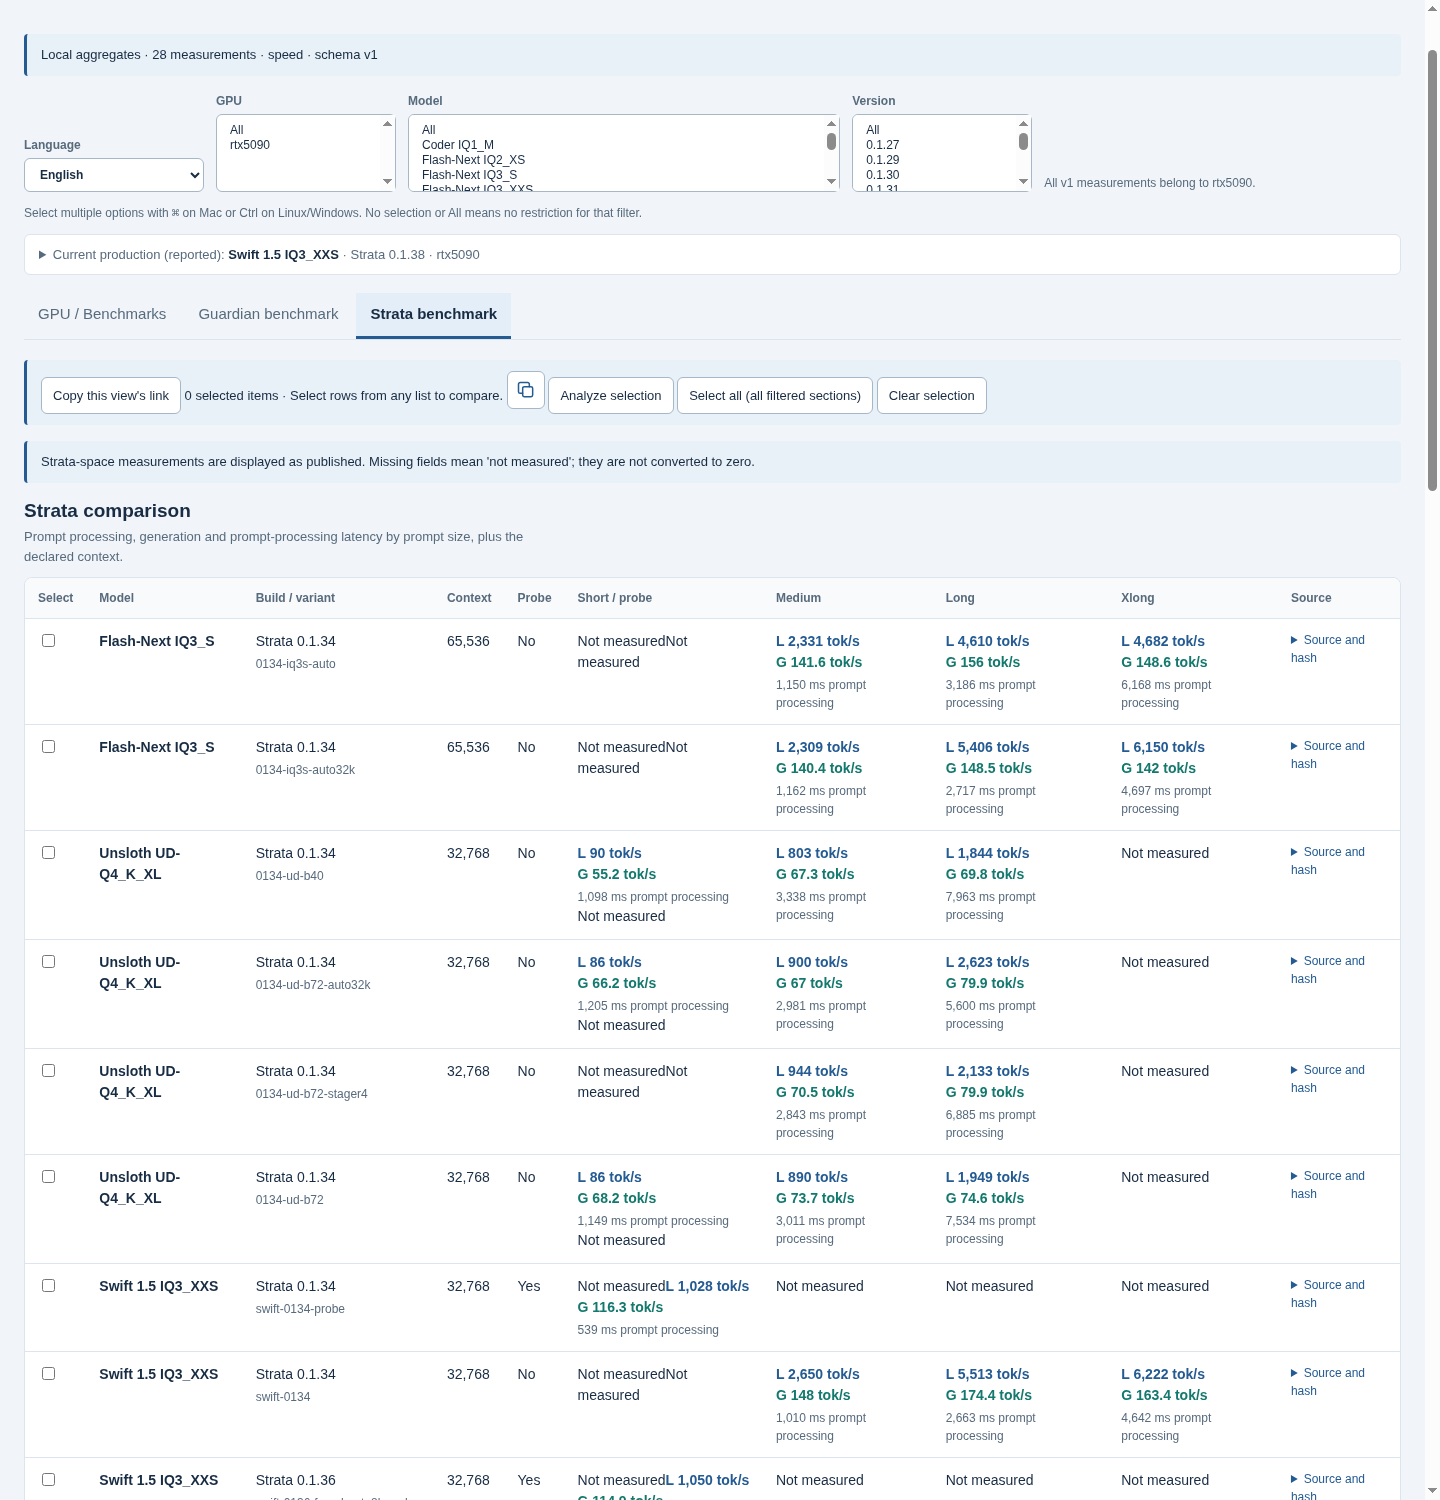 In the proposal, every row opens a "Reproduce this row" panel. It shows the engine version and binary hash, model files and hashes, the config as used, the protocol id with links to the prompt files, the runner version, and the command to repeat it. You can copy the config, copy the command, or open the raw JSON. A "diff against my config" view lists the `args` and `env` differences between that row and your own config. 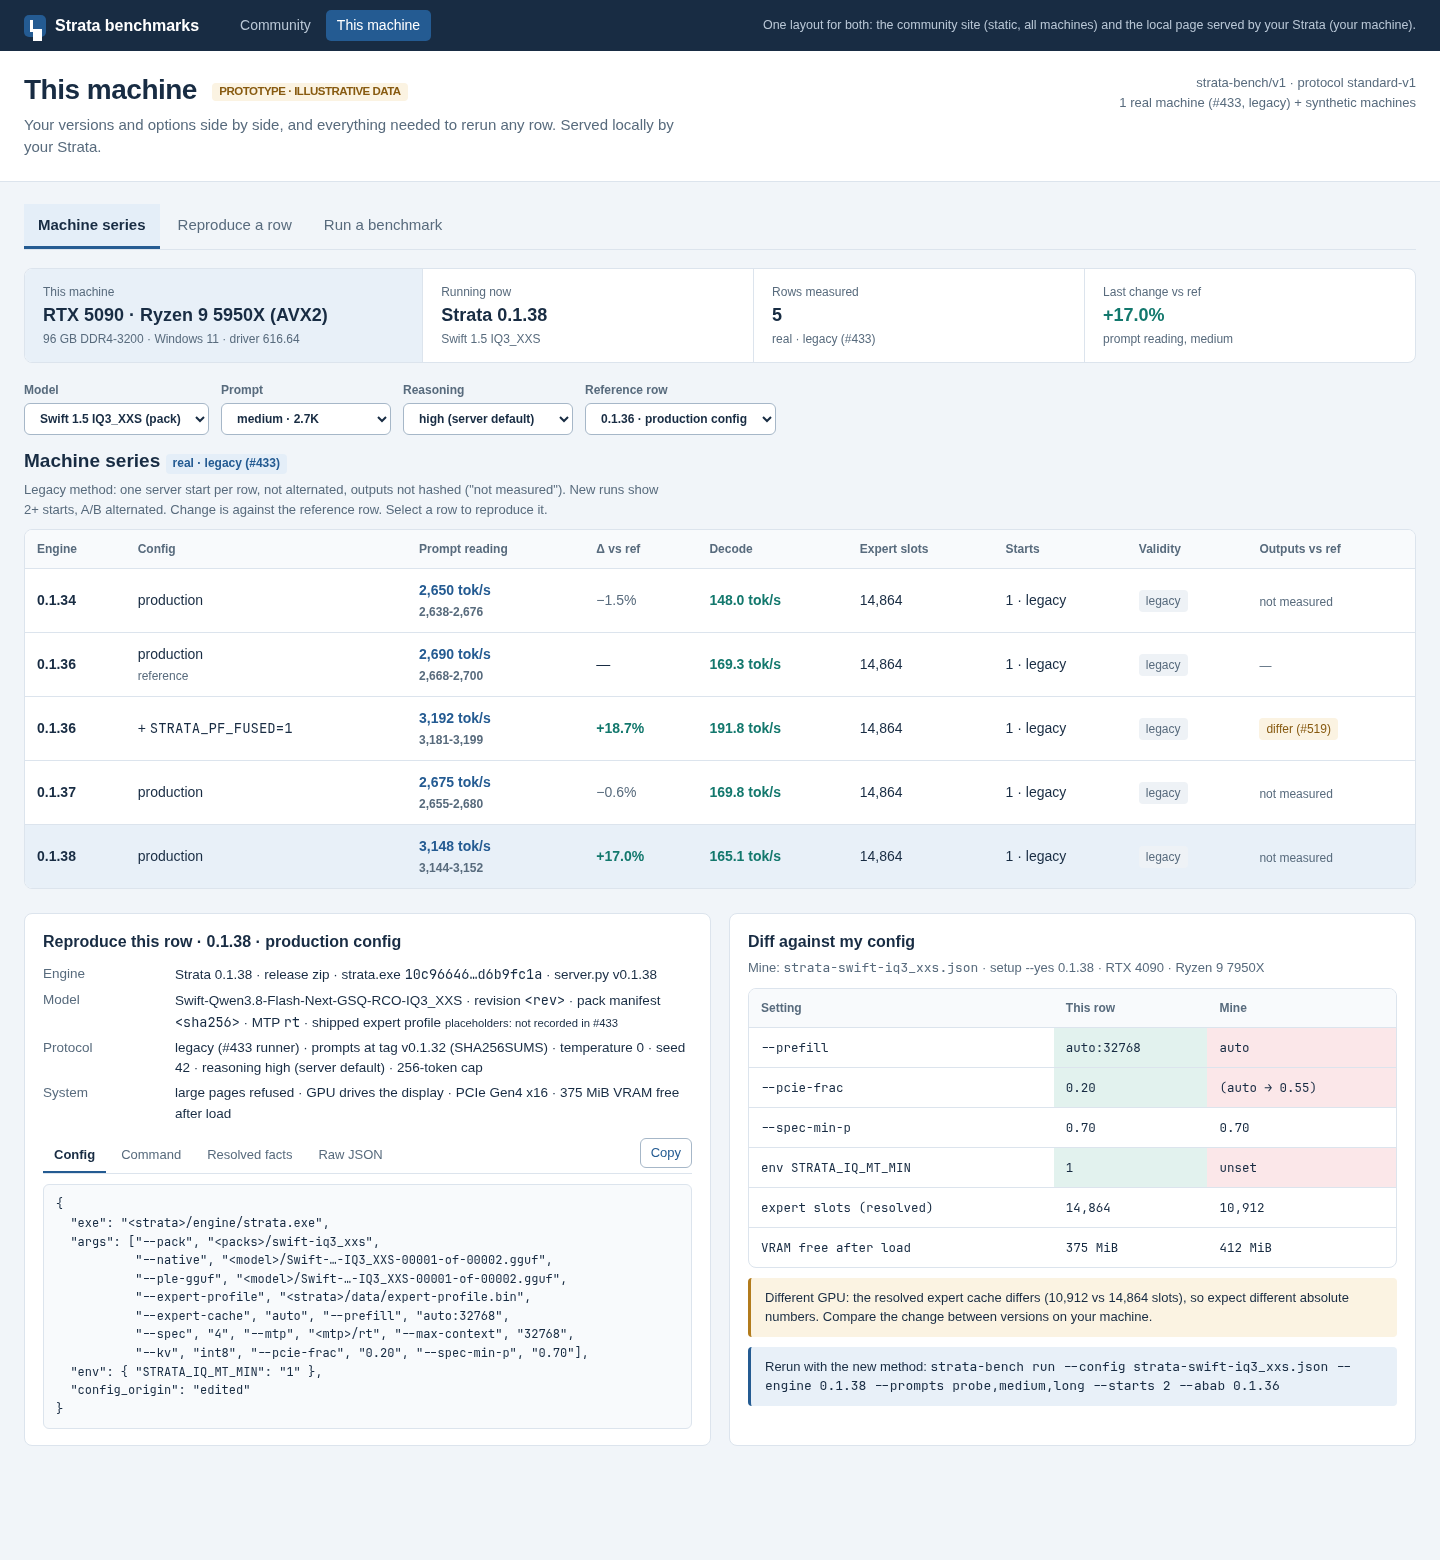 ## A participation guide and a checklist The runner does most of the work, but people still need to know what gets collected and what to check. If you want this, it would come with a one-page guide covering what is measured and what isn't, which fields end up public, how to submit, and why a submission can be kept out of the statistics (cache reuse, missing metadata, low free VRAM after load). It would also come with a short checklist: - Before: close other GPU apps, note whether the GPU drives a display, use your normal config unchanged, don't recalibrate. - During: at least two server starts per side, arms alternated, reasoning settings recorded. - After: run the validator, review what will be published, submit. The runner ticks off whatever it can check by itself. The rest is on the person running it. ## What I'm asking Would this be useful to you? If it is, where should it live: somewhere you choose, a separate repo linked from `docs/COMMUNITY_BENCHMARKS.md`, or nowhere? I'd rather know that before building anything for real. If you're in, I can do the runner, the schema and the page, and convert my #433 data. I'm also happy to maintain it afterwards (reviewing submissions and updating the protocol for new releases) so it doesn't add work on your side.
站内延伸阅读
链到安装、模型与版本说明,便于 SEO/GEO,非官方 issue 正文。