Pull requests / #2979
#2979 serve: durable opt-in lifetime token counters in Monitor
open · @Zcg2021 · 0 comentarios · En GitHub
BenchmarksSetup & installServer & APIAMD / HIPNVIDIA / CUDAModels & quantsDocumentationWindows
Descripción
## Summary
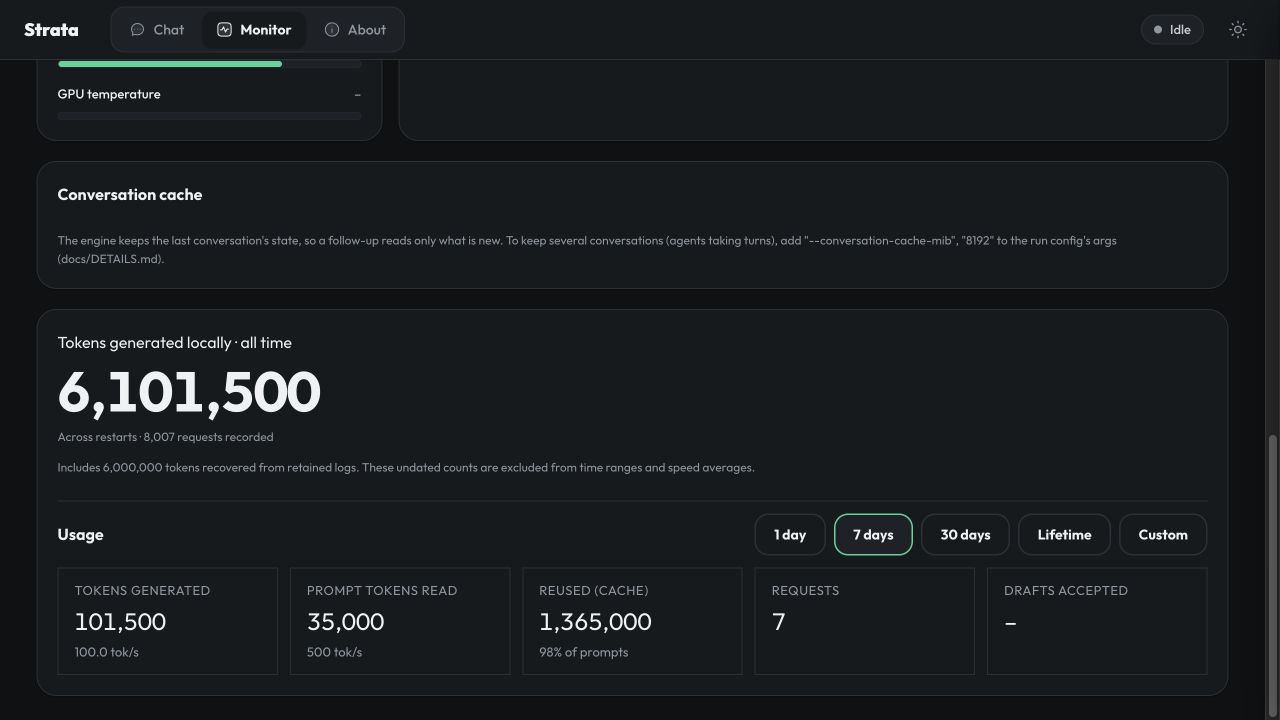
Add opt-in, durable lifetime request/token statistics and a **Tokens generated locally · all time** headline in a Usage card appended at the bottom of Monitor. The original speed, hardware and cache layout stays first.
**Attribution / relation to existing work:** this builds on @wokhouse's #2370, with its original six commits retained. It addresses the persistence and disabled-UI concerns raised there, adds Windows validation and keeps the all-time output total visible within the Usage card. This is a consolidated alternative for maintainers to review; if #2370 lands first, the follow-up changes can be split out. Related usage proposals: #2400 and #2204.
## What changed
The foundation from #2370 provides bounded hourly/daily buckets, lifetime totals, date filters and `/metrics.usage`. This PR adds:
- **Save each settled request**, including a request followed by a long idle period. Write a unique temporary file, flush/fsync it, then replace the snapshot atomically. There is no disk write per generated token.
- **Cross-process ownership** using a separate lock file (`msvcrt` on Windows, `flock` on POSIX). A second server cannot overwrite an active owner's ledger. Sequential model configurations can deliberately share a `usage_stats_path`.
- **Visible persistence failures**, preserving the preceding disk snapshot and retaining new counts in memory for retry. Corrupt JSON is copied aside before new counters are saved; fractional timings survive reload.
- **A permanent all-time output headline**, independent of the selected 1d/7d/30d/lifetime/custom window. Optional undated log-backfill counters are labelled and excluded from date ranges and speed averages.
- **Disabled stays disabled:** no added `/metrics` usage field, no visible card, no usage file. Existing session totals remain unchanged.
- Regression tests for forced process exit, concurrent recording, competing writers, failed replace/retry, corrupt files, partial cancellation/disconnect and tool-call accounting.
Only counters and bucket timestamps are persisted. No prompts, answers, tool arguments, credentials or request bodies are stored by this feature. No native code, model format, quantization, context, cache or scheduler defaults change.
### Enable
```json
{
"usage_stats": true
}
```
Or use `serve/server.py --usage-stats`. The default path is beside the model run config. Optional `usage_stats_path` (or `STRATA_USAGE_STATS`) selects a shared file for model profiles run one at a time; its parent must already exist. Simultaneous servers should use distinct stores.
## Validation
Results on 2026-10-17, after syncing with upstream main `477ac13c`:
| Host | Result | Time |
| --- | --- | --- |
| macOS | 389 tests passed | 116.549 s |
| Windows 11 | 389 tests run: 386 passed, 3 Unix-signal tests skipped | 116.853 s |
`node --check serve/web/app.js` and `git diff --check` also passed. The Windows run used an isolated copy
of this PR, without stopping the production service. Its first package omitted the upstream
`tools/test_strata_tokenizer.py` helper; after supplying that file, the complete suite above passed.
Reproduction steps and the persistence workload are in [`docs/usage-stats-validation.md`](https://github.com/Zcg2021/Strata/blob/codex/usage-stats-reliability/docs/usage-stats-validation.md).
Windows persistence cost, Ryzen 9 5900X / 128 GB RAM / RTX 3090: 100 settled-request saves with 744 hourly + 31 daily buckets (~150 KB snapshot) measured **10.78 ms median / 12.30 ms p95 / 18.11 ms max**. This is statistics overhead, **not an inference throughput claim**.
Additional integration on the existing Windows installation: streaming/non-streaming Chat Completions and Responses agreed with disk totals; tool-call preemption/resume, cancellation while paused and disconnect while paused agreed with session totals. A native-model smoke request generated 4 tokens, and API usage, the JSON ledger and the rendered total each increased by exactly 4. That installed integration uses an older server baseline plus a separate scheduling patch; it is supplementary evidence, not substituted for the PR-head tests above.
## UI
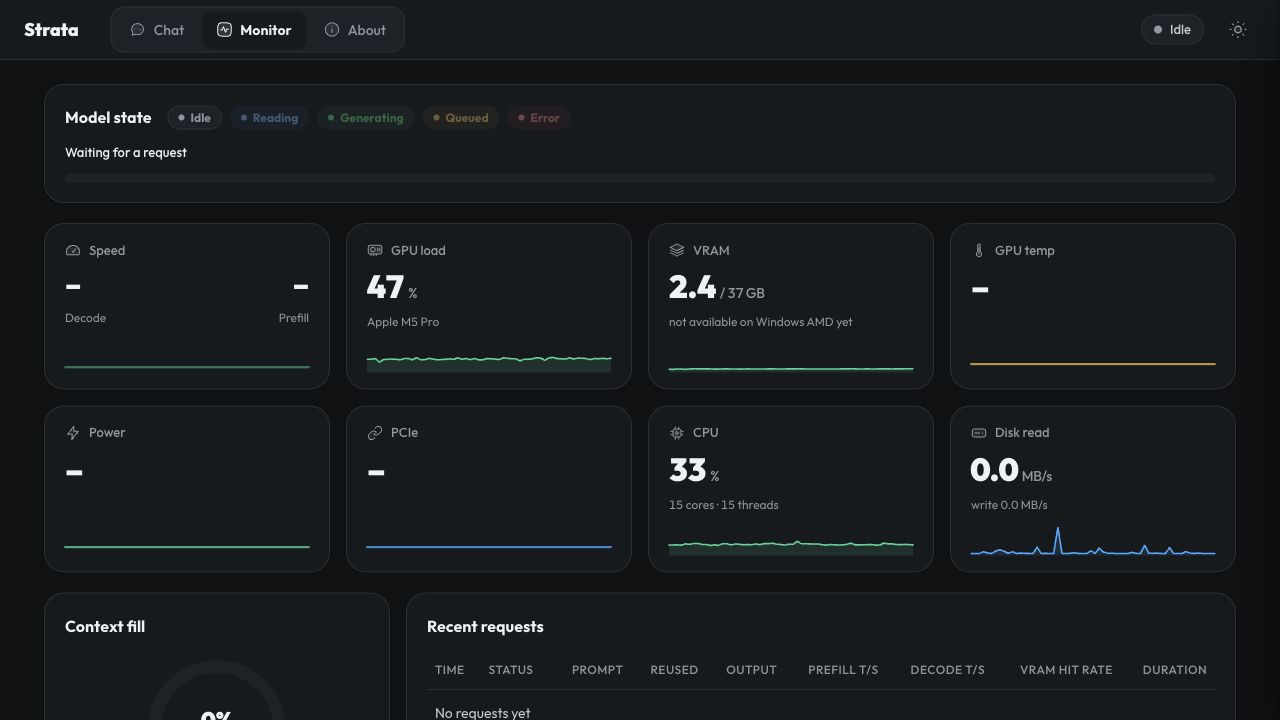
Screenshots show the original Monitor sections first, with Usage appended at the bottom. Usage counters are synthetic, including an explicitly labelled undated import. Hardware readings come from the preview host; this is not an inference benchmark.
<details>
<summary>Usage at the bottom</summary>
</details>
## Limits and accounting
- An active request killed **before settlement** is not included. Graceful cancellation/disconnect is settled and counted once.
- No physical power-loss test; forced process exit and reopen were tested. Disk errors remain visible rather than claiming the new counts were saved.
- Output includes reasoning and tool-call tokens counted by the server. Reused input and rejected speculative drafts are not new output.
- Undated imports are a schema option, not an automatic log scraper. Retained logs cannot establish missing historical dates or recover deleted history. Do not import work already counted by the store.
- No native backend rebuild was needed: CUDA/HIP/SYCL sources are unchanged.
En el sitio
Enlaces a install, modelos, releases.