Pull requests / #2326
#2326 batch-groups: read a cold prompt beside the decoding slots, stall 11.9 -> 0.8 s, same work 6.4% sooner (opt-in)
open · @SuperDistance · 0 Kommentare · Auf GitHub
BenchmarksServer & APIMulti-GPUAMD / HIPNVIDIA / CUDAModels & quantsDocumentationWindowsLinux
Beschreibung
## Title Issue: Related: #2275, #1906 and #1603 (on the pipelined groups every decoding stream stops for a whole prompt read), and #2050 (the other approach, reads in pieces; this PR does not depend on it). ## Motivation I run Strata as the backend for coding agents on 2x RTX 5090. Every new agent starts with a long cold prompt, and with `--batch-groups` > 1 every agent that is already decoding stops until that prompt is read. vLLM and SGLang avoid this with chunked prefill: a new prompt's chunks share batches with the running requests' decode steps. #2050 brought the time-sliced form of that here (the read in pieces, taking turns with decode windows), but every turn drains the pipeline, so the new prompt waits longer, and with a coarse chunk one piece is still about 21 s of reading (superniker on #2050). Strata's prompt path and its decode windows use different kernels and buffers, so they cannot share one forward pass, but they can run at the same time on the same GPUs. That is this PR. ## Summary With `STRATA_PIPED_CONCURRENT=1` (opt-in, experimental) a cold prompt is read on a thread of its own while the slot groups keep decoding. With the variable unset nothing changes: main's tokens (SHA-256 equal) at main's speed. On 2x RTX 5090, four streams decoding while a 64K and a 32K cold prompt join: | | main | this mode | | --- | ---: | ---: | | longest pause of a stream | 11.9 s | **0.8 s** | | the streams' rate while the prompts are read | 2-3 tok/s | **85-92 tok/s** | | both GPUs busy while the prompts are read | 80% | **88%** | | **the same work done in** | 26.1-27.1 s | **24.6-25.3 s, 6.4% sooner** | | the joining prompts' first token | 6.8 / 5.8-5.9 s | 8.1-8.2 / 8.2-8.3 s | | a one-line question 1 s into a cold 45K read: its first token | 5.7-5.9 s | **1.9 s** | The whole workload finishes sooner because the GPUs stay busier during a read; on main they sit partly idle while every stream waits. The price is the joining prompt's own first token, which comes 20-47% later. 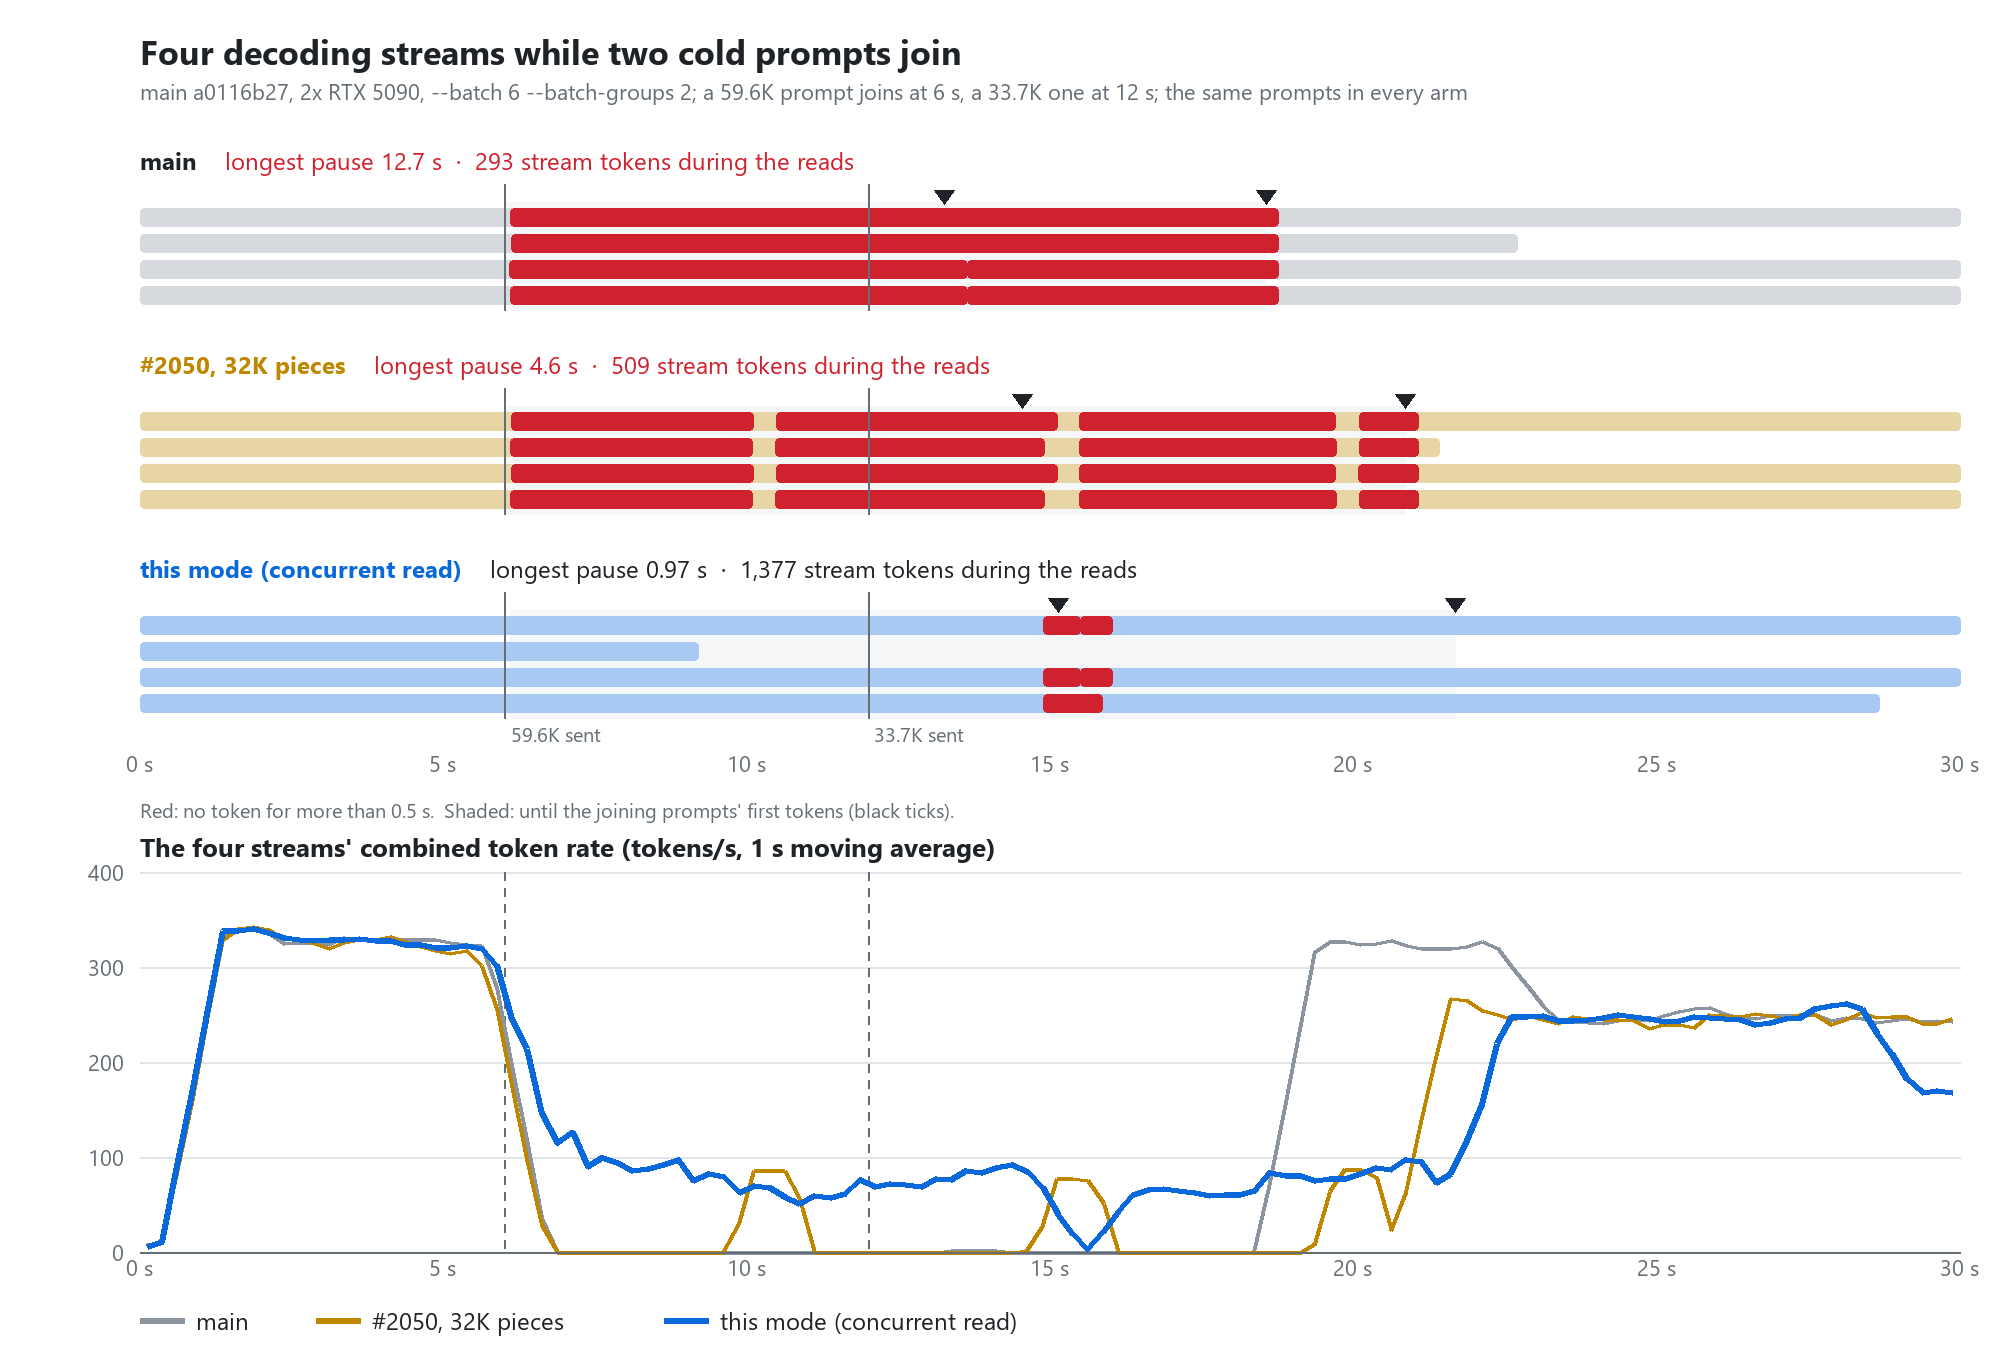 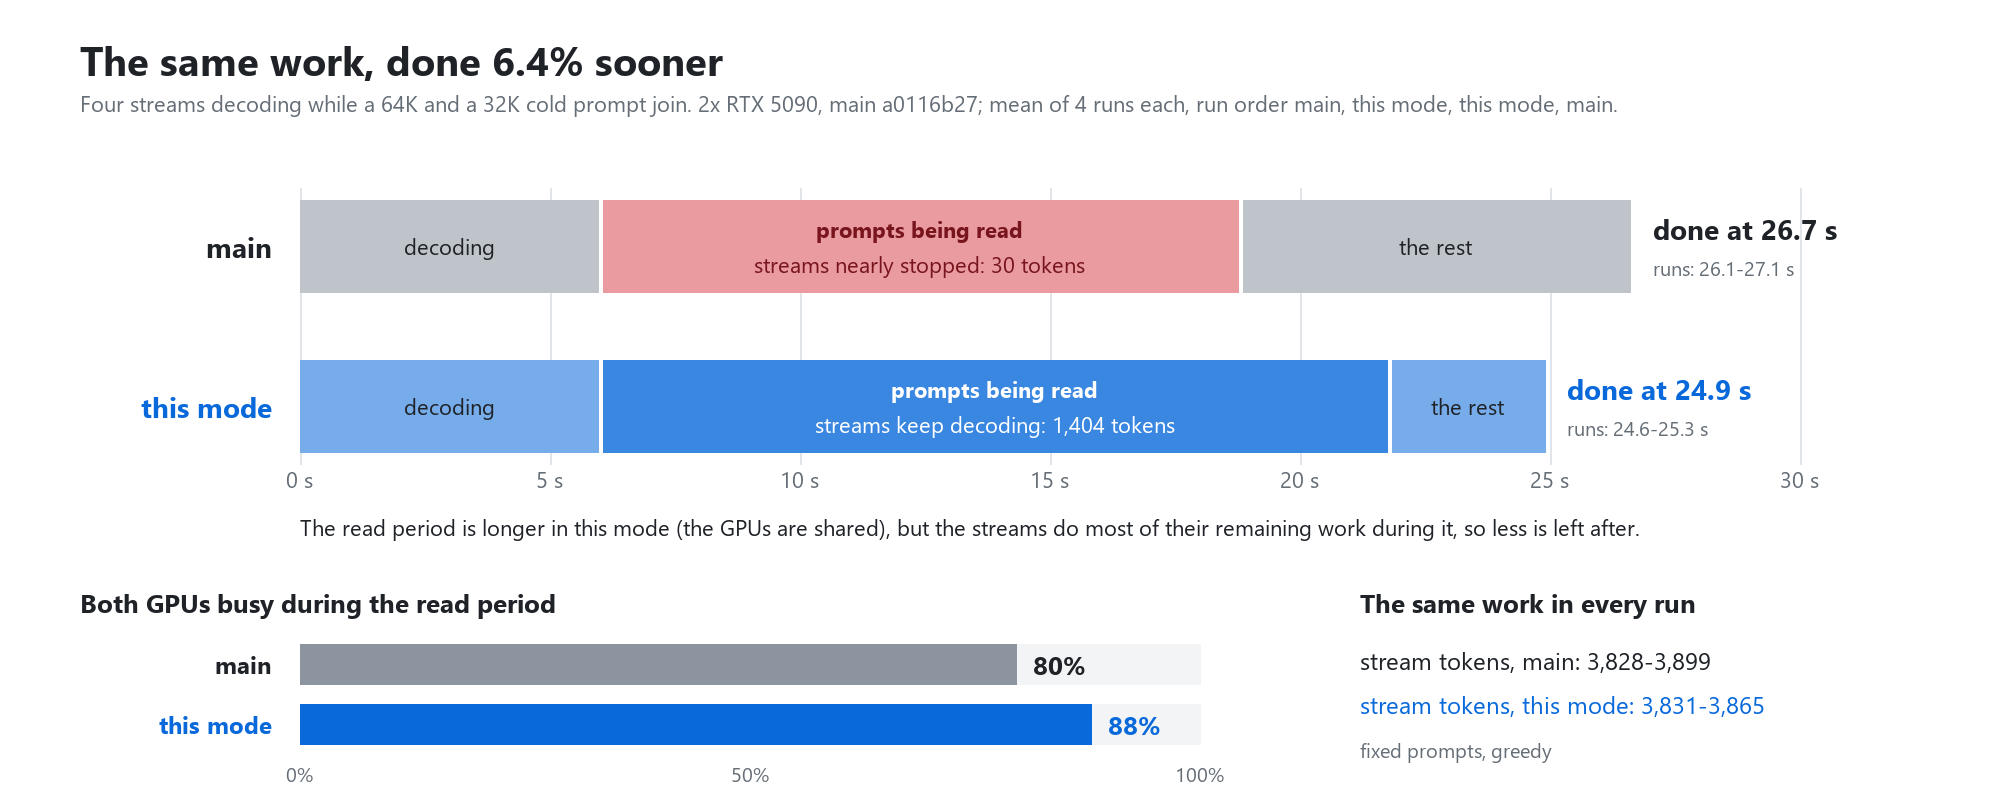 ## How it works - The read runs on a worker thread. The main thread keeps the groups decoding through the pipeline (`pump`) and takes `BSTOP` and `BYIELD` meanwhile. - Two rules keep it from hanging: the slots' doorbells are served by a thread that never calls CUDA, and nothing is allocated or freed on the read's threads (everything is sized before the read starts). - The windows' streams get the device's highest priority on CUDA. - A `BYIELD` ends the read at its next chunk, and the part read waits in a slot, as #656's give-way does. - The stall watchdog stays on for the whole read. - On Linux the read's threads run off the host thread's core and the pool workers' CPUs (a new thread there inherits the host thread's one-core mask; Windows' CPU Sets are not inherited). <details><summary>Where the two rules come from, and what an independent review found</summary> Two hangs turned up while building this, both read from the engine's stall dumps against its PDB. Both had #31's shape: the main thread waited for the CUDA driver's lock in `cudaSetDevice` while the lock's holder waited for the GPU (a `cudaFree` in the drafter's prompt pass, then cuBLASLt's lazy load of a GEMM module), and a window on that GPU waited for its doorbell. A doorbell served by a thread that never calls CUDA cannot be held up that way. An independent review then found five more things, fixed in the third commit: configurations where serving a doorbell does call CUDA (the mode is now off there), #1996's pinned upload rings growing mid-read (now reserved first), a window that would never finish going unnoticed, the watchdog switching itself off when the last slot finished mid-read, and a rare race that could serve a new window with the previous one's row count. </details> ## How to review 1. `src/program/generate.cpp`, `read_part`: the block under `if (piped && pr_conc && req_imgs.empty())`, then `pump`'s two changes (the watchdog during a read, the launch that wakes the doorbell thread). 2. `src/core/verify.cpp`: `batch_serve` is `batch_poll`'s per-layer service moved out unchanged. 3. Everything else enforces the two rules above. `concurrent_read_off` (`batch_read.hpp`, tested in `batch_read_test`) lists the configurations where the mode stays off. ## Results Measured on 2x RTX 5090 (Swift 1.5 IQ3_S, split 25, `--batch 6 --batch-groups 2`), engines built from main `a0116b27`. - **Against #2050's 32K pieces:** longest pause 0.97 s against 4.6 s (main 12.7 s), and 1,377 stream tokens during the reads against 509 (main 293). - **The same work, sooner:** 6.4% over four runs each, counted only on runs that did the same work; the ranges do not overlap. - **Host RAM and VRAM** (ylzbj1-stack's question on #1906): the read and the decoding now compete. The read gives up about a sixth of its speed, the streams keep 22-29% of their rate instead of almost none, and the engine uses 16.6 cores against 6.3. VRAM stays flat. - **Exactness:** with the determinism settings, two runs gave byte-identical answers while a 136K prompt was read beside a 105K conversation. - **An hour of randomised load:** 1,723 requests, 1,125 reads beside decoding slots and 558 give-ways, with no stall and no error; memory stayed flat. - **16 GB cards and a weaker host:** the same shape, but the joining prompt pays more (67-109% later on 16 GB cards). - **Linux** (WSL2 on the same machine, main `ed4773eb`, #2050's bench): a cold 32K join stops the streams 0.7 s against 6.1-6.5 s on main and 2.9-3.1 s with #2050's 16K pieces, and they emit 925-1,065 tokens during it against 222-229 and 814-860. The first version kept the read's threads on the host thread's core there (6.1 rows/s on blange48's 4x RTX 5080); the sixth commit fixes that. - **In my local testing** (coding agents, first 18 hours): 8,503 requests and 5,052 reads beside decoding slots, with no stall and no hang. <details><summary>Tables and method</summary> **Against #2050** (a cold 59.6K prompt at 6 s and a 33.7K one at 12 s, the same prompts in every arm): | | main | #2050, 32K pieces, 400 ms | this mode | | --- | ---: | ---: | ---: | | longest pause of a stream | 12.7 s | 4.6 s | **0.97 s** | | the streams' tokens while the prompts are read | 293 | 509 | **1,377** | | the prompts' first token | 7.3 / 6.6 s | 8.5 / 8.9 s | 9.0 / 9.7 s | With a second prompt under half the first one's length (72.4K and 28.1K), the long read gives way at its next chunk by #656's rule, here at 57,344 of 72,368 tokens: the short prompt gained little (7.4 against main's 7.1 s) and the long one waited for it (17.2 against 8.3 s). A rule that compares what is left to read, as @blange48 carries on #2170, would skip a give-way that late; that belongs in its own PR. **The same work, sooner.** The four streams send the same prompts in every run, greedy, and their answers came out the same length (3,828-3,899 tokens on main, 3,831-3,865 here). Finishing time is the last stream's last token. Order main, this mode, this mode, main. Both arms decode at about 330 tok/s before the joins; main then stops the streams for about 12.8 s, while this mode keeps them near 90 tok/s through a 15.7 s read, which puts it 1.5-2 s ahead. GPU busy is `nvidia-smi`'s utilization every 100 ms during the read period. The gain depends on how much of the time is spent reading; with no reads there is none. **Host contention** (the cold 64K prompt read alone, then beside the decoding streams; read speeds from the engine's line for the whole request): | full config, four streams of 40K | main | #2050, 32K pieces | this mode | | --- | ---: | ---: | ---: | | the read alone | 8,581 tok/s | 7,442 tok/s | 8,731 tok/s | | the read beside the streams | 8,606 tok/s (they stop) | 7,418 tok/s (they wait) | 7,331 tok/s (-16%) | | the streams before / during the read | 345 / 4 tok/s | 348 / 18 tok/s | 303 / 67 tok/s | | longest pause of a stream | 7.7 s | 4.7 s | **0.48 s** | | the engine's CPU during the read | 6.3 cores | 4.7 cores | 16.6 cores | | CPU-bound host (20 GB of each card reserved, experts not resident, AVX2, 6 pool workers), one stream | main | this mode | | --- | ---: | ---: | | the read alone | 5,226 tok/s | 5,307 tok/s | | the read beside the stream | 5,180 tok/s (it stops) | 4,508 tok/s (-15%) | | the stream before / during the read | 92 / 1.3 tok/s | 93 / 27 tok/s | | the stream's longest pause | 12.6 s | **0.31 s** | **16 GB cards** (`--vram-reserve-mib 16600 --kv-resident 16384`): the streams' rate during the reads 0.9 -> 52.9 tok/s, all four done 70.6 -> 63.8 s, GPUs busy 80% -> 92%, the joining prompts' first token 9.5 / 10.1 -> 15.8 / 21.1 s. **A weaker host** (16 GB cards, experts from the mapped file, AVX2, 6 pool workers, `--batch 2`): a stream's longest stop 11.1 -> 0.41 s beside a 64K read and 20.3 -> 0.64 s beside a 127K one, the prompt's first token +4-7%. **Linux** (WSL2, Ubuntu 24.04, the same machine and engine, all builds on main `ed4773eb` with #2050's commits applied for its arm; `piped_read_join_bench.py`'s cold32k, followup and two_joiners; the n-gram table in RAM in every arm, since WSL's disk reads it about 7x slower; 2-3 runs each): | | main | #2050, 16K pieces | this mode, first version | this mode | | --- | ---: | ---: | ---: | ---: | | cold32k: longest stream stop | 6.1-6.5 s | 2.9-3.1 s | 0.8-0.9 s | **0.7 s** | | cold32k: the joining prompt's first token | 5.8-6.1 s | 9.6-10.0 s | 8.2-8.6 s | 7.0-7.3 s | | cold32k: stream tokens during the join | 222-229 | 814-860 | 454-484 | **925-1,065** | | followup: a short prompt 1 s into a cold 45K read, its first token | 6.4-6.6 s | 2.7 s | 1.7-1.8 s | **1.6-2.0 s** | | two_joiners: longest stream stop | 15.6-15.9 s | 5.9-6.0 s | 1.7-2.0 s | **1.2-1.6 s** | | two_joiners: stream tokens during the joins | 303-313 | 1,460-1,559 | 664-718 | **1,796-2,046** | The slots decoded 24-37 rows/s during a 30K+ read with the first version and 95-127 with the fix. **Exactness.** With the usual settings near-tie tokens flip a little more often than on main (the prompt path borrows some of the decode's GPU expert slots, and those experts run on the CPU kernels, which round differently). With `--pcie-frac 0 --adapt-swaps 0 --prompt-cache 0 --no-prefill-borrow` this mode's two runs were byte-identical for all three answers; release's two runs with the same settings still differed. In `batch_interleave_test.py --long 40000` every request equaled its solo tokens in two runs of three; the third had a near tie that flips on main as well. With the variable unset, six greedy answers' SHA-256 equal main's in two engine starts each. **Load.** The hour: four streams, cold joins of 4-128K every 4-15 s, short questions, follow-ups, clients leaving mid-read; GPU0's VRAM grew 82 MiB over 80 minutes (in my local testing an engine grew 44 MiB in its first hours and then held). My local testing ran v0.1.43 with #2050 and this ported; against the 20 hours before it on #2050's pieces, the slowest tenth of long reads fell from 15.8 to 7.5 s, but the workload differed, so that is not a controlled A/B. </details> ## Costs and limits - The joining prompt's first token comes 20-47% later (67-109% on 16 GB cards). - The read is about 15% slower beside decoding streams, and the engine uses more of the host (16.6 cores against 6.3). - A
Mehr auf der Site
Links zu Install, Modellen, Releases.